Guide
Super El Niño Winter 2026–27: NOAA’s Odds for Your State, and What to Do About Your House
A very strong El Niño tilts this winter warmer in the North and wetter across the South. Here’s the official outlook, state by state, and the one deadline that matters.

CheckedNov. 122026

The short answer
NOAA expects a warmer North and a wetter South this winter. El Niño is still strengthening: on Nov. 12, 2026, its key ocean reading hit +2.5°C, and NOAA puts the chance of a record-strength event at about 60%.
For December through February, NOAA favors above-average temperatures across the northern U.S. and above-average rain and snow from California to Florida and up the East Coast. Your state’s odds are in the table below.
If you live in the wet zone, the house move is flood insurance: homeowners policies don’t cover flooding, and a new flood policy typically takes 30 days to start, FEMA says.
At a glance
- El Niño now
- Very strong and still strengthening: +2.5°C in Niño-3.4 (NOAA, Nov. 12)
- Odds it lasts
- Better than 79% strong to very strong through Jan.–March 2027
- Record event
- About 60% chance it’s the strongest since 1950
- Winter outlook
- Dec.–Feb.: warmer North; wetter South and East Coast; near normal in Florida
- Snow
- NOAA doesn’t forecast seasonal snowfall
- Flood insurance
- Not in homeowners policies; typically a 30-day wait (FEMA)
- Next updates
- Outlook Nov. 19; El Niño update Dec. 10
- Last checked
- Thursday, Nov. 12, 2026, against the sources at the end of this page
How strong this El Niño is
NOAA’s Climate Prediction Center put out its monthly update on Nov. 12, 2026. El Niño is still getting stronger: the key ocean reading, in a stretch of the Pacific called Niño-3.4, hit +2.5°C above normal.
NOAA gives a better than 79% chance it stays strong to very strong through January–March 2027. It puts the odds of a historic event, stronger than any El Niño on record back to 1950, at about 60% for the fall and early winter.
“Super El Niño” is what people search for, but it isn’t NOAA’s term. NOAA says “strong” and “very strong,” and expects it to start weakening in early 2027.
What NOAA expects for December through February
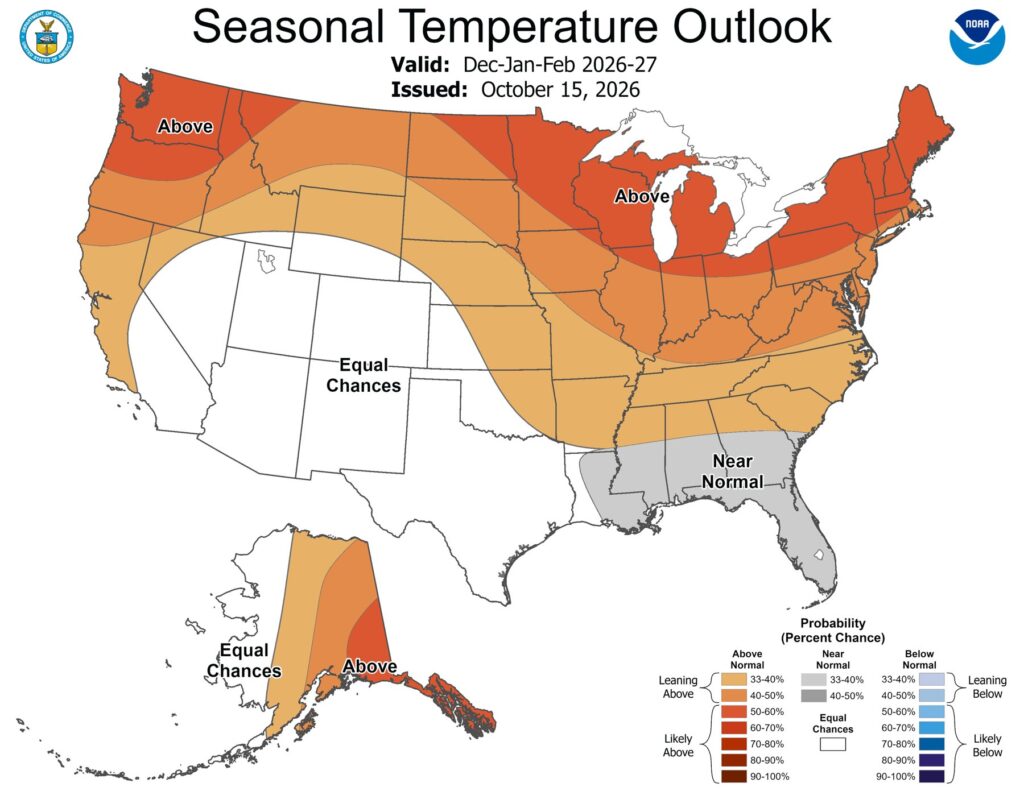
NOAA’s U.S. Winter Outlook, issued Oct. 15, 2026, gives the odds for the three months from December to February. In short: warmer North, wetter South and East.
- Warmer than average: northern California, the Pacific Northwest, the Midwest, the Mississippi Valley, much of the East and Alaska. The odds are highest across the northern tier, from Washington to Maine.
- Near normal temperatures: parts of the Southeast, including Florida.
- Equal chances of a warm, normal or cold winter: much of the Southwest and Hawaii.

- Wetter than average: the whole southern tier, from Southern California to Florida, and up the East Coast. The strongest odds are in Florida and along the Southeast coast, up to 70% to 80%.
- Drier than average: parts of the northern Rockies and the Great Lakes, central Alaska and Hawaii.
- Drought should ease or end in the Southwest, the Southern Plains, the Southeast and parts of the East Coast, and may get worse in the northern Rockies, northeastern Oregon and eastern Washington.
These are odds, not a forecast for a given day. A “40% chance of warmer” still leaves room for a cold month or a big storm.
The outlook for your state
We read NOAA’s official outlook files for December to February and looked up the odds at each state’s biggest city, plus a second or third city in California, Florida, Missouri, New York, Pennsylvania and Texas, where the map changes across the state.
Highlighted rows have a 50% or higher chance of a wetter winter, where flood planning matters most.
| State | City we checked | Temperature, Dec. to Feb. | Rain and snow, Dec. to Feb. |
|---|---|---|---|
| Alabama | Birmingham | Warmer (33–40% chance) | Wetter (33–40% chance) |
| Alaska | Anchorage | Warmer (40–50% chance) | Equal chances |
| Arizona | Phoenix | Equal chances | Wetter (50–60% chance) |
| Arkansas | Little Rock | Warmer (33–40% chance) | Wetter (33–40% chance) |
| California | Los Angeles | Equal chances | Wetter (50–60% chance) |
| California | Sacramento | Warmer (33–40% chance) | Wetter (40–50% chance) |
| Colorado | Denver | Equal chances | Wetter (33–40% chance) |
| Connecticut | Hartford | Warmer (50–60% chance) | Wetter (40–50% chance) |
| Delaware | Wilmington | Warmer (40–50% chance) | Wetter (40–50% chance) |
| District of Columbia | Washington | Warmer (40–50% chance) | Wetter (40–50% chance) |
| Florida | Miami | Near normal (33–40% chance) | Wetter (50–60% chance) |
| Florida | Tampa | Near normal (33–40% chance) | Wetter (70–80% chance) |
| Florida | Jacksonville | Near normal (33–40% chance) | Wetter (70–80% chance) |
| Georgia | Atlanta | Warmer (33–40% chance) | Wetter (40–50% chance) |
| Idaho | Boise | Warmer (40–50% chance) | Equal chances |
| Illinois | Chicago | Warmer (50–60% chance) | Equal chances |
| Indiana | Indianapolis | Warmer (40–50% chance) | Equal chances |
| Iowa | Des Moines | Warmer (40–50% chance) | Wetter (33–40% chance) |
| Kansas | Wichita | Warmer (33–40% chance) | Wetter (40–50% chance) |
| Kentucky | Louisville | Warmer (40–50% chance) | Equal chances |
| Louisiana | New Orleans | Near normal (33–40% chance) | Wetter (60–70% chance) |
| Maine | Portland | Warmer (50–60% chance) | Wetter (33–40% chance) |
| Maryland | Baltimore | Warmer (40–50% chance) | Wetter (40–50% chance) |
| Massachusetts | Boston | Warmer (50–60% chance) | Wetter (40–50% chance) |
| Michigan | Detroit | Warmer (50–60% chance) | Equal chances |
| Minnesota | Minneapolis | Warmer (50–60% chance) | Equal chances |
| Mississippi | Jackson | Near normal (33–40% chance) | Wetter (40–50% chance) |
| Missouri | Kansas City | Warmer (33–40% chance) | Wetter (33–40% chance) |
| Missouri | St. Louis | Warmer (40–50% chance) | Equal chances |
| Montana | Billings | Warmer (33–40% chance) | Drier (33–40% chance) |
| Nebraska | Omaha | Warmer (33–40% chance) | Wetter (33–40% chance) |
| Nevada | Las Vegas | Equal chances | Wetter (40–50% chance) |
| New Hampshire | Manchester | Warmer (50–60% chance) | Wetter (33–40% chance) |
| New Jersey | Newark | Warmer (40–50% chance) | Wetter (40–50% chance) |
| New Mexico | Albuquerque | Equal chances | Wetter (40–50% chance) |
| New York | New York City | Warmer (40–50% chance) | Wetter (40–50% chance) |
| New York | Buffalo | Warmer (50–60% chance) | Equal chances |
| North Carolina | Charlotte | Warmer (33–40% chance) | Wetter (50–60% chance) |
| North Dakota | Fargo | Warmer (50–60% chance) | Equal chances |
| Ohio | Columbus | Warmer (40–50% chance) | Equal chances |
| Oklahoma | Oklahoma City | Equal chances | Wetter (40–50% chance) |
| Oregon | Portland | Warmer (50–60% chance) | Equal chances |
| Pennsylvania | Philadelphia | Warmer (40–50% chance) | Wetter (40–50% chance) |
| Pennsylvania | Pittsburgh | Warmer (40–50% chance) | Equal chances |
| Rhode Island | Providence | Warmer (40–50% chance) | Wetter (40–50% chance) |
| South Carolina | Charleston | Warmer (33–40% chance) | Wetter (60–70% chance) |
| South Dakota | Sioux Falls | Warmer (40–50% chance) | Wetter (33–40% chance) |
| Tennessee | Nashville | Warmer (33–40% chance) | Equal chances |
| Texas | Houston | Equal chances | Wetter (50–60% chance) |
| Texas | Dallas | Equal chances | Wetter (40–50% chance) |
| Texas | El Paso | Equal chances | Wetter (40–50% chance) |
| Utah | Salt Lake City | Equal chances | Equal chances |
| Vermont | Burlington | Warmer (50–60% chance) | Equal chances |
| Virginia | Virginia Beach | Warmer (33–40% chance) | Wetter (50–60% chance) |
| Washington | Seattle | Warmer (50–60% chance) | Equal chances |
| West Virginia | Charleston | Warmer (40–50% chance) | Wetter (33–40% chance) |
| Wisconsin | Milwaukee | Warmer (50–60% chance) | Equal chances |
| Wyoming | Cheyenne | Equal chances | Wetter (33–40% chance) |
The percentage is NOAA’s chance that the season lands in that category. With three possible outcomes, 33% is a coin toss; 50% or more is a strong lean.
What it means for your house
If you’re in the wet zone: think about flood insurance now
NOAA’s weather service chief warned that heavy rain on dry ground can fuel flash floods and mudslides. For the South, California and the East Coast, the house question is water.
Regular homeowners insurance doesn’t cover flooding, according to FEMA. Flood insurance is a separate policy, mostly sold through FEMA’s National Flood Insurance Program, for owners and renters alike.
The catch is timing: there’s typically a 30-day waiting period before a new flood policy kicks in. Buy it in mid-November and it starts around mid-December, about when the wettest odds begin.
The waiting period doesn’t apply when your lender requires the policy or when it’s tied to a change in your community’s flood map, FEMA says. You can get a quote at FloodSmart.gov, from the agent who sells your home or car insurance, or by calling the NFIP at (877) 336-2627.
FEMA’s Ready.gov list for getting a house ready for floods is short:
- Clear drains and gutters so water moves away from the house.
- Install check valves so sewer water can’t back up into your drains.
- Consider a sump pump with a battery backup, which keeps running when the power goes out.
- Move valuables to higher levels, out of the basement.
- Make password-protected digital copies of important documents.
If you’re in the North: a warmer lean, not a free pass
Warmer-than-average odds across the northern tier usually mean fewer cold days to heat through. Our winter heating cost calculator uses the federal government’s forecast for your fuel and state.
A mild season can still bring a hard freeze. Pipes don’t care about the three-month average: our guide to frozen pipes covers what to do before and after a cold snap, and our ice melt comparison covers icy steps and driveways.
Snow: nobody can tell you yet
NOAA’s outlook doesn’t forecast seasonal snowfall. The agency says snow is generally not predictable more than about a week ahead, so a “snow map” for the whole winter isn’t something NOAA puts out.
For storms, NOAA’s weather service this season added a tool that shows the low, expected and high snow totals for a storm, and will use “particularly dangerous situation” wording for the worst blizzards and ice storms.
El Niño in one minute
El Niño is a warming of the ocean along the equator in the central and eastern Pacific. The warm water changes where storms form and pushes the jet stream south and east over the U.S.
That’s why the South gets stormier and the North milder in a typical El Niño winter. The stronger the event, the more the odds tilt, though NOAA notes that even a very strong El Niño doesn’t guarantee the usual pattern.
How we built the state table
NOAA’s Climate Prediction Center publishes each seasonal outlook as map files, not only as pictures. We took the December–February 2026–27 files issued Oct. 15, 2026, and checked which shaded area each city falls in. Hawaii has its own outlook and isn’t in those files; its line above comes from NOAA’s release.
The next outlook comes out Nov. 19, and the next El Niño update on Dec. 10. We’ll refresh the table when they do.
What we don't know yet
- How much snow any city gets. NOAA doesn’t make seasonal snow forecasts.
- Whether NOAA’s Nov. 19 outlook shifts the odds. The table uses the Oct. 15 outlook, the latest when we checked.
- What a flood policy would cost for your house. NFIP prices depend on the building, its location and its flood risk; FloodSmart.gov gives a quote.
When any of this is confirmed, it goes into the page and the update history below.
Questions people ask
What does El Niño mean for winter 2026–27?
NOAA favors a warmer-than-average winter across the northern U.S. and a wetter-than-average one across the southern U.S., from California to Florida, and along the East Coast. Florida and parts of the Southeast lean near normal for temperature.
Is this a super El Niño?
“Super El Niño” isn’t NOAA’s term, but NOAA calls it strong to very strong. On Nov. 12, 2026, it put the chance of the strongest El Niño since records began in 1950 at about 60%.
Will El Niño bring more snow this winter?
NOAA doesn’t forecast seasonal snowfall; snow is generally predictable only about a week ahead. Wetter odds in the South and East raise the chance of storms, but whether they bring rain or snow depends on the temperature during each storm.
What does El Niño mean for Florida this winter?
NOAA gives Florida 50% to 80% odds of a wetter-than-average winter, among the highest in the country, with near-normal temperatures most likely.
What does El Niño mean for California?
Wetter than average is favored in both cities we checked: 50% to 60% odds in Los Angeles and 40% to 50% in Sacramento. Northern California also leans warmer.
What does El Niño mean for Texas?
Wetter than average is favored: 50% to 60% in Houston, 40% to 50% in Dallas and El Paso. Temperature has equal chances.
When will El Niño end?
NOAA expects it to keep strengthening and then start weakening in early 2027, staying strong to very strong through January–March.
Does homeowners insurance cover flooding?
No. FEMA says most homeowners policies don’t cover flood damage. Flood insurance is a separate policy, mostly through the National Flood Insurance Program, and usually takes 30 days to start.